How to Build a Sales Tracking Spreadsheet in Google Sheets (With Contracts Attached to Each Deal)
Build a sales tracking spreadsheet in Google Sheets with pipeline stages, weighted deal values, and a free template, plus contracts attached to each deal.

A CRM is a big commitment for a small team still figuring out its sales process. Before you pay per seat, a sales tracking spreadsheet gives you the essentials: every deal, what stage it’s in, and how much your pipeline is really worth.
Google Sheets is more than up to it. With stage dropdowns and a weighted-value formula, a plain sheet becomes a pipeline you can actually forecast from.
This guide builds a sales tracker from scratch, then shows you how to keep each deal’s contract and quote attached to the deal itself.
Key Highlights
- A sales tracking spreadsheet in Google Sheets lists every deal with its company, stage, value, and expected close date.
- A weighted value formula (value times probability) shows what your pipeline is realistically worth.
- SUMIF totals your pipeline by stage, so you see where deals are piling up.
- Conditional formatting color-codes stages, making won and lost deals obvious.
- A deal row holds numbers, but not the paperwork. UpSheet is a Google Sheets extension by The Conductor that lets you attach the quote, proposal, or signed contract directly to each deal’s row, so the whole deal lives in one place.
What does a sales tracking spreadsheet need?
Open a new Google Sheet and create these columns:
- Deal name (A)
- Company (B)
- Stage (C)
- Value (D)
- Probability % (E)
- Weighted value (F)
- Expected close (G)
- Owner (H)
Make Stage a dropdown (Data → Data validation → Dropdown) with your pipeline stages: Lead, Qualified, Proposal, Negotiation, Won, and Lost. Make Owner a dropdown too if you have a team.
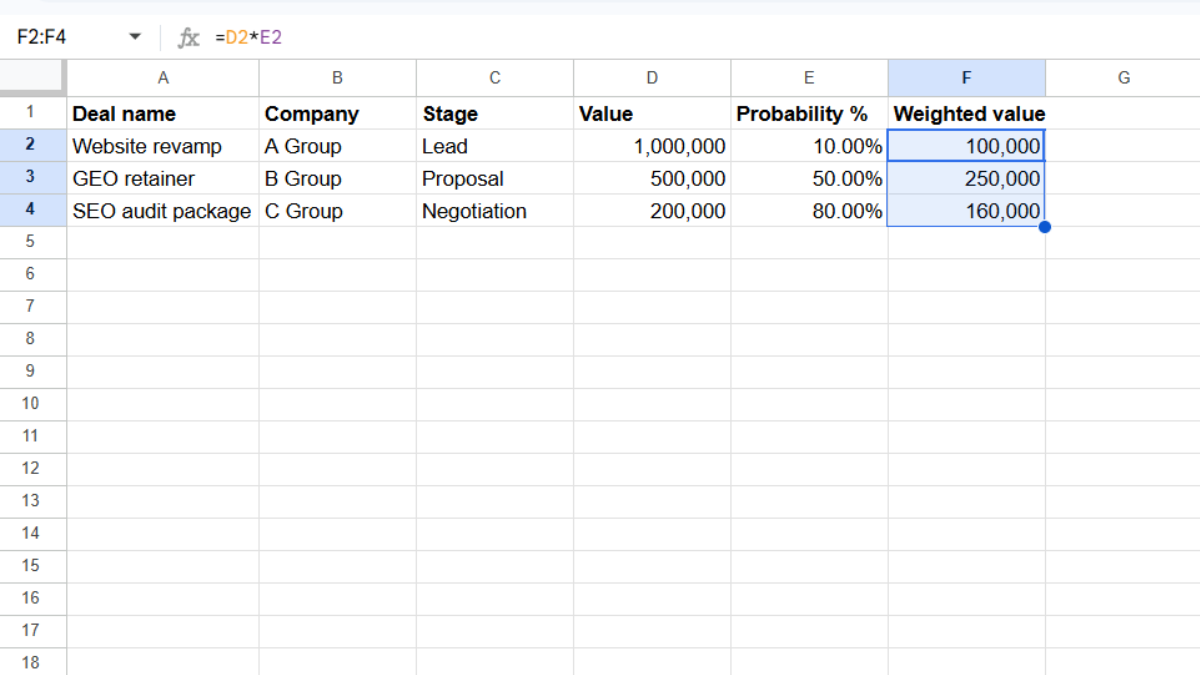
How do you calculate weighted pipeline value? (1)
Raw deal value is optimistic. A deal at the Lead stage is not worth the same as one in Negotiation. Weighted value accounts for that.
In F2, enter:
=D2*E2
Drag it down. (Make sure column E is formatted as a percentage.) Now each deal shows its realistic, probability-adjusted value.
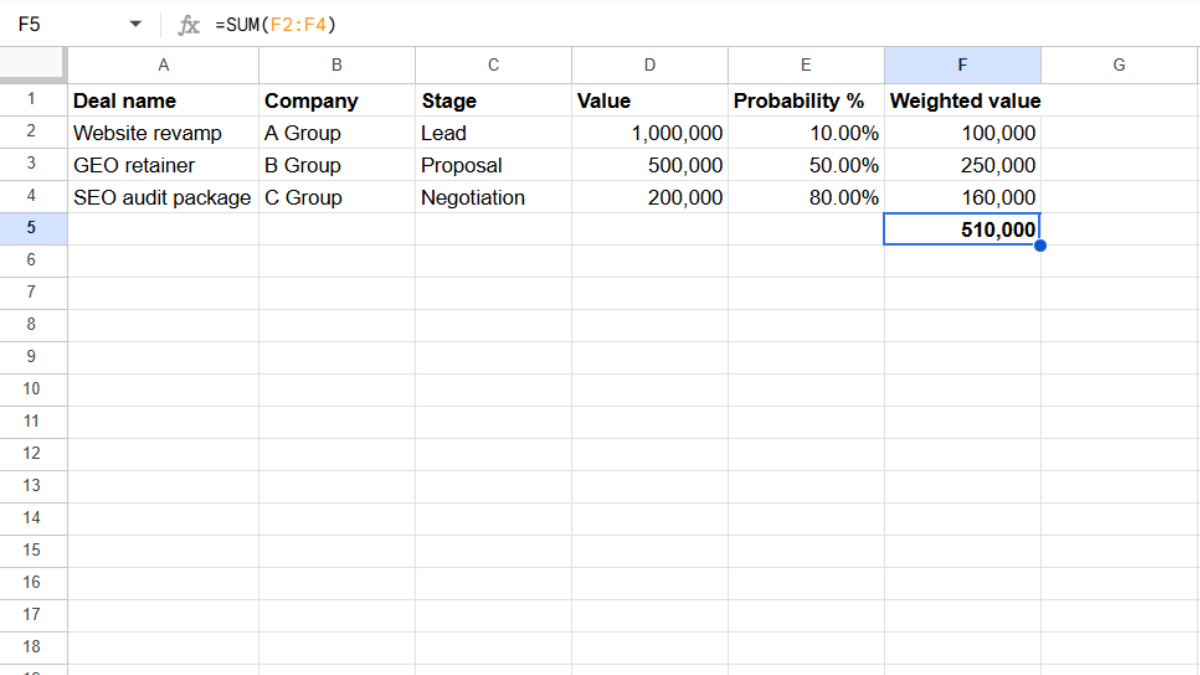
For your total weighted pipeline:
=SUM(F2:F4)
That single number is your honest forecast.
How do you total the pipeline by stage? (2)
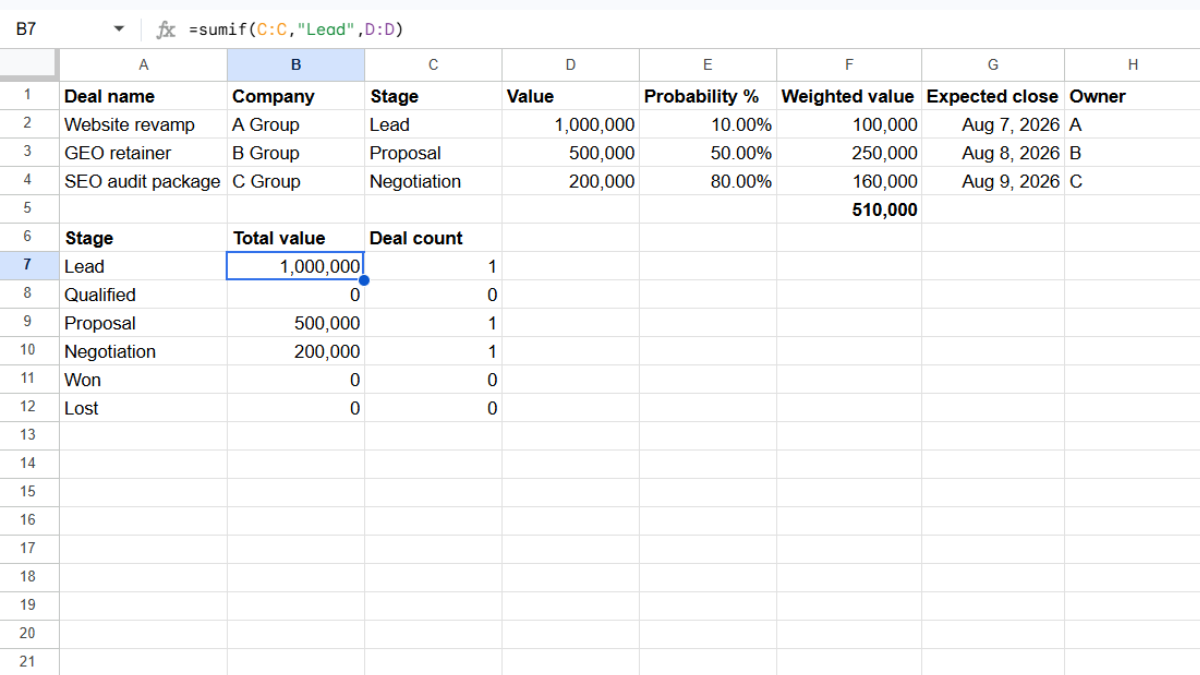
To see where deals cluster, total value by stage with SUMIF:
=SUMIF(C:C, "Lead", D:D)
Repeat for each stage. If everything is stuck at Proposal, that’s a signal you can act on.
You can also count deals per stage with COUNTIF for a quick pipeline snapshot.
How do you color-code deal stages? (3)
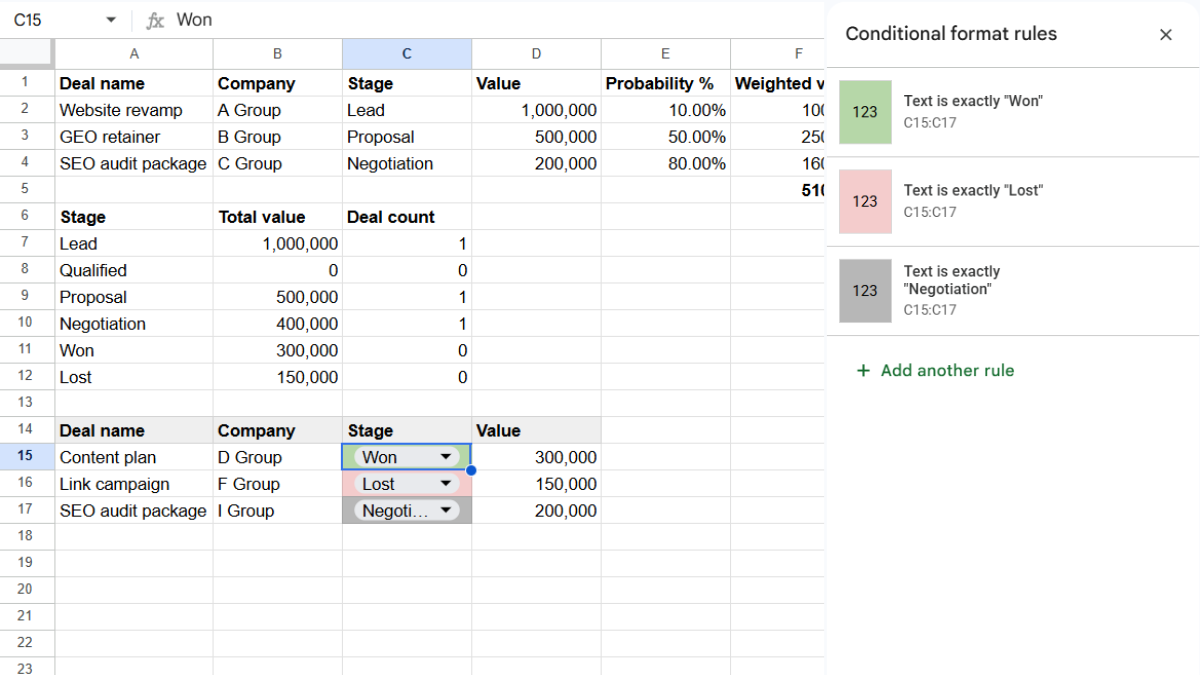
Conditional formatting makes the pipeline readable at a glance.
- Select your deal rows and open Format → Conditional formatting.
- Add a rule: Text is exactly “Won”, green fill.
- Add another: Text is exactly “Lost”, gray fill.
- Add another for “Negotiation” in a bold color to highlight what’s close.
Now a glance tells you the health of the whole pipeline.
Where do the contracts and quotes live?
Here’s where a sales spreadsheet alone falls short. Every deal generates documents: the quote you sent, the proposal deck, the signed contract, the terms you agreed. Those are the deal, as much as the number is.
But they live in email and Drive, not in the tracker. When a deal closes and finance needs the signed contract, or a client disputes terms, you’re searching your inbox instead of clicking the deal.
This is where UpSheet fits in. UpSheet is a Google Sheets extension, built by The Conductor, that lets you drag and drop files straight onto a cell. You attach the quote, proposal, or signed contract directly to the deal’s row.
Drop the file on the deal, and UpSheet stores it in a dedicated Google Drive folder for that sheet and marks the cell with a 📎 paperclip. Every deal now carries its own paperwork, one click away.
In TABLE mode, each document stays tied to its deal even as you sort the pipeline by stage or close date, so contracts never drift to the wrong deal. Drag, Drop, Done.
Frequently asked questions
How do I create a sales tracking spreadsheet in Google Sheets?
List each deal with company, stage, value, probability, and expected close. Use a stage dropdown, calculate weighted value with =value*probability, and total your pipeline by stage with SUMIF.
How do I calculate weighted pipeline value?
Multiply each deal’s value by its probability of closing, for example =D2*E2 with probability formatted as a percentage. Sum the weighted column for a realistic pipeline forecast rather than an optimistic raw total.
How do I track sales stages in Google Sheets?
Add a stage column as a dropdown (Lead, Qualified, Proposal, Negotiation, Won, Lost), then use conditional formatting to color-code stages and SUMIF to total value at each stage.
Can I attach contracts to deals in Google Sheets?
Yes, with UpSheet. Drag the quote, proposal, or signed contract onto its deal’s row, and it saves to the sheet’s Drive folder with a paperclip marker, so the paperwork stays attached to the deal it belongs to.
Organize Your Work, Simplify Your Life
A sales tracker shows what your pipeline is worth. UpSheet keeps the quotes and contracts behind each deal attached to the deals themselves.
Start your 14-day free trial. It works inside the Google Sheet you already use, so there’s nothing new to learn. Pro is $9.99/month (or $79.99/year) when you’re ready.