How to Make a Gantt Chart in Google Sheets
Learn how to make a Gantt chart in Google Sheets step by step, with a free template method, plus the easiest way to keep every task’s files in one place.
You have a project with a dozen moving parts, and everyone keeps asking the same question: what’s happening this week, and what’s next?
You could keep answering in Slack. Or you could build a Gantt chart once and let the timeline answer for you.
The good news is you don’t need expensive software. Google Sheets can turn a plain task list into a clear project timeline in about ten minutes, using a tool it already has built in.
Here’s exactly how to make a Gantt chart Google Sheets builds for free, step by step.
Key Highlights
- Google Sheets has no native Gantt chart, but you can build one from a stacked bar chart plus two helper columns, with no add-ons required.
- You need three things per task: a task name, a “days from start” offset, and a duration in days. Two quick formulas calculate the last two for you.
- The trick that makes it look like a Gantt chart: hide the “days from start” bars by setting their fill to transparent, so only the duration bars show.
- Reverse the vertical axis order so your tasks read top to bottom, matching how you listed them.
- A Gantt chart shows when work happens, but not the files behind each task. UpSheet is a Google Sheets extension by The Conductor that lets you drag and drop the brief, mockup, or deliverable straight onto each task’s row, so the plan and the files live in one place.
What is a Gantt chart Google Sheets can build?
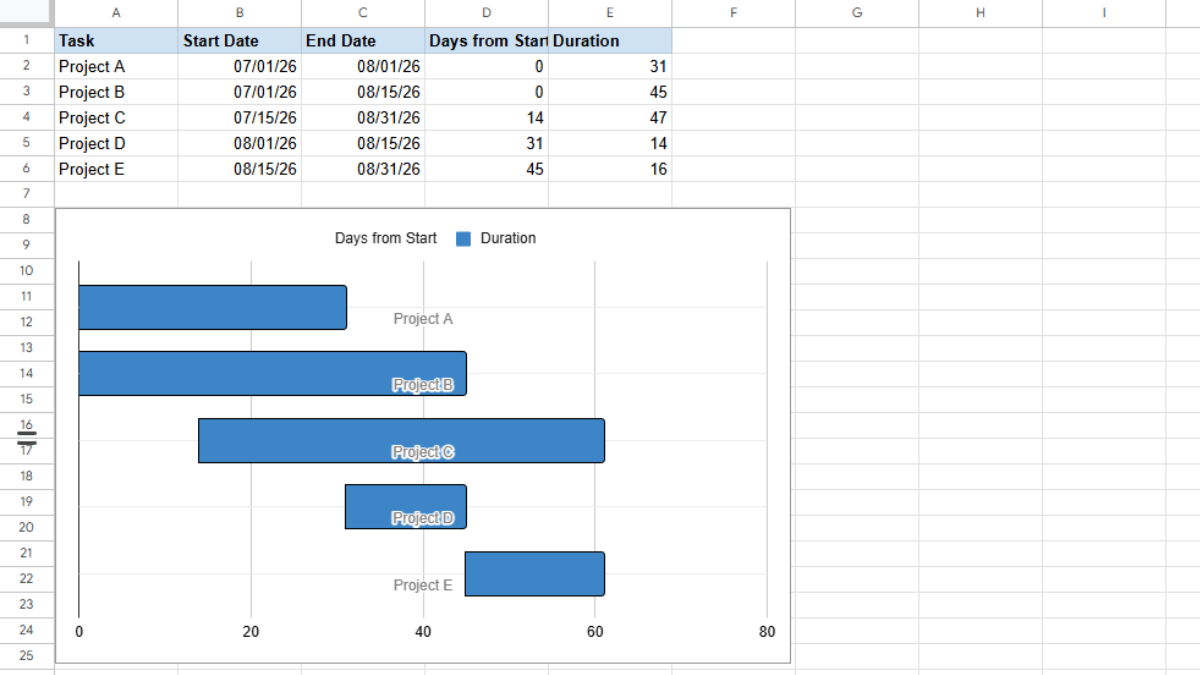
A Gantt chart is a horizontal bar chart that lays your project out on a timeline. Each task becomes a bar: where the bar starts shows when the task begins, and how long it runs shows the duration.
Google Sheets doesn’t include a true Gantt chart tool. Instead, you build one using a stacked bar chart and a couple of helper columns that do the timeline math. It’s a well-established method, it’s free, and it works entirely with built-in features.
It’s a great fit when your plan is fairly simple and you need everyone to see the same schedule in a spreadsheet they already share.
How do you set up your project data for a Gantt chart?
Everything depends on clean source data, so start here. Open a new Google Sheet and build a simple table with three columns:
- Task (column A): a short, clear name for each task.
- Start Date (column B): when the task begins, formatted as a date.
- End Date (column C): when the task finishes, formatted as a date.
Now add two helper columns next to it. These do the timeline math the chart needs:
- Days from Start (column D): how many days after the project’s first day this task begins.
- Duration (days) (column E): how many days the task lasts.
In cell D2, enter this formula and drag it down:
=B2-MIN($B$2:$B$9)
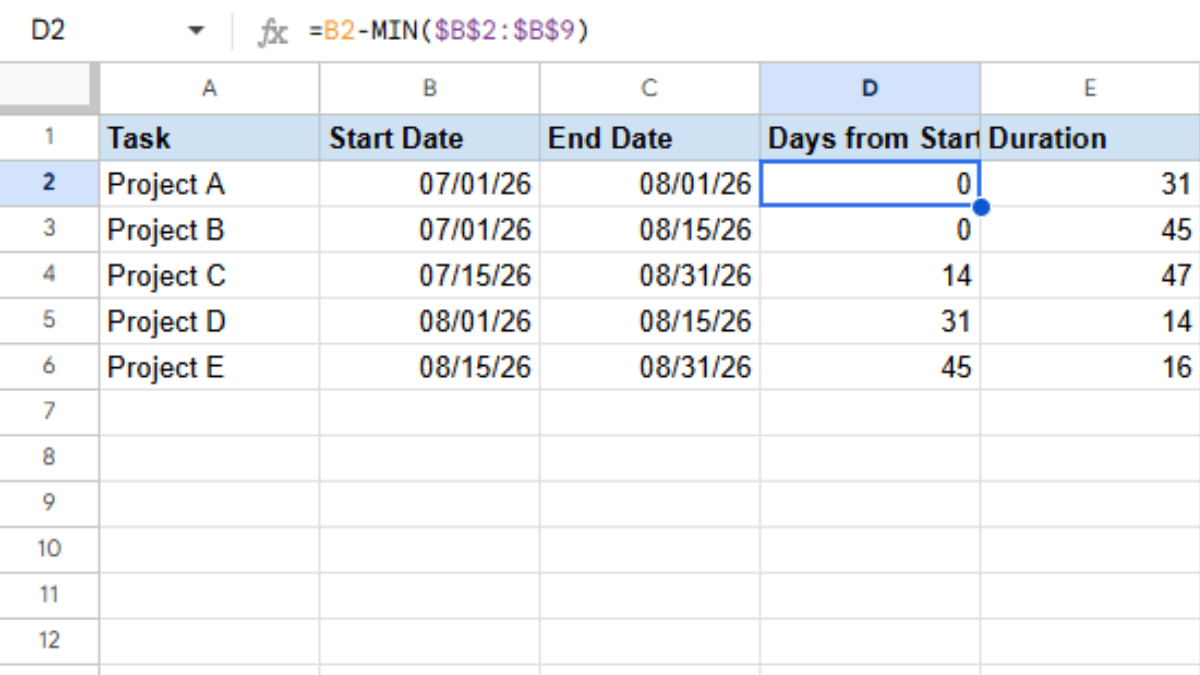
This subtracts the project’s earliest start date from each task’s start date, giving you the offset in days. (The $ signs lock the range so it doesn’t shift as you drag.)
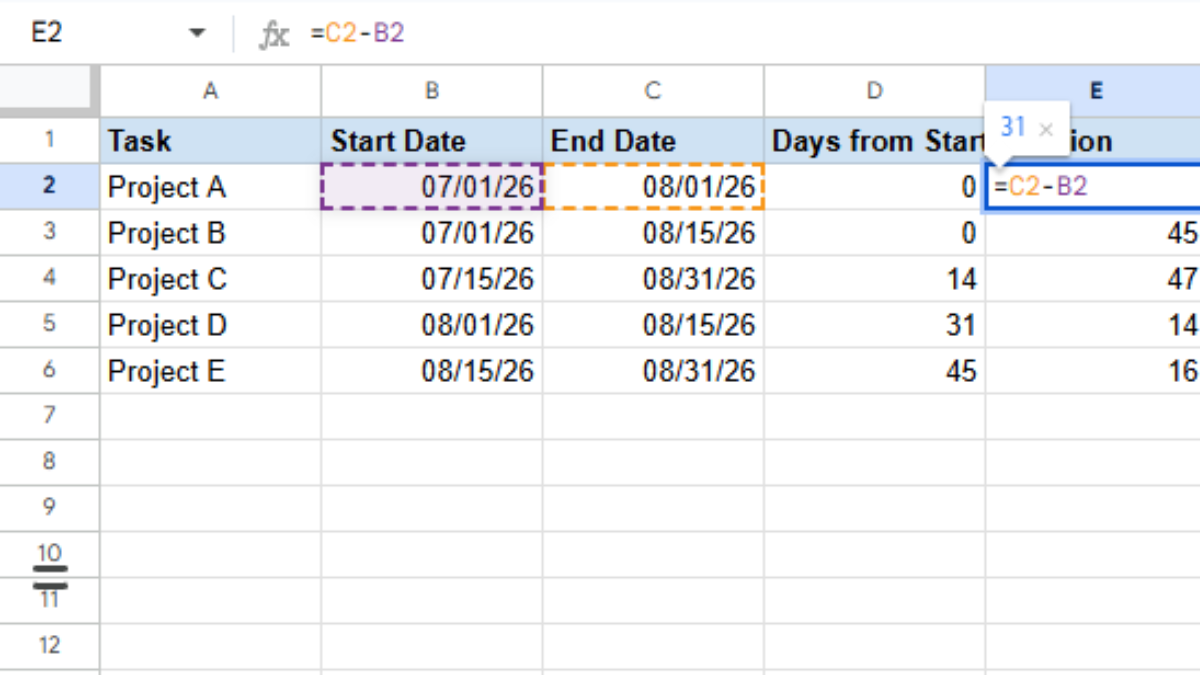
In cell E2, enter this and drag it down:
=C2-B2
This gives each task’s length in days.
How do you turn a stacked bar chart into a Gantt chart in Google Sheets?
With your data ready, the build itself is quick.
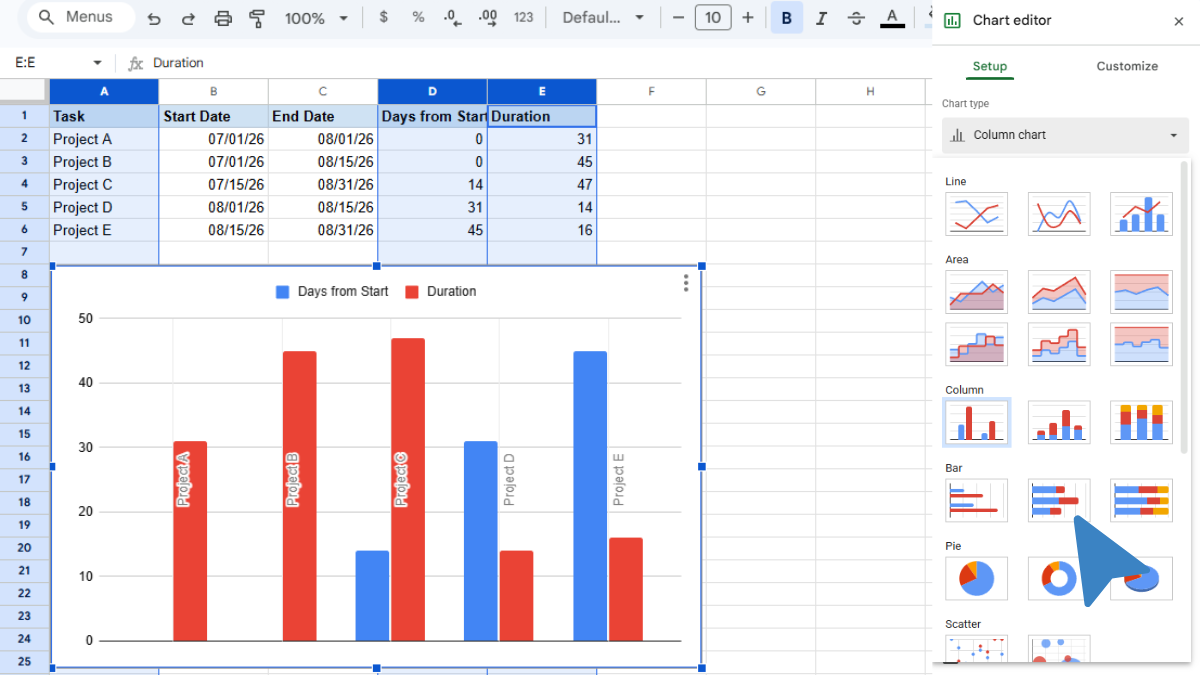
- Select the Task, Days from Start, and Duration columns. To grab non-adjacent columns, click the A column header, then hold Ctrl (Windows) or Cmd (Mac) and click the D and E headers.
- Go to Insert → Chart. The Chart editor opens on the right.
- In the Setup tab, open the Chart type dropdown and choose Stacked bar chart (under the “Bar” group).
You’ll now see bars with two colored segments per task, one for “Days from Start” and one for “Duration.”
Now the one move that makes it look like a real Gantt chart. You hide the first segment:
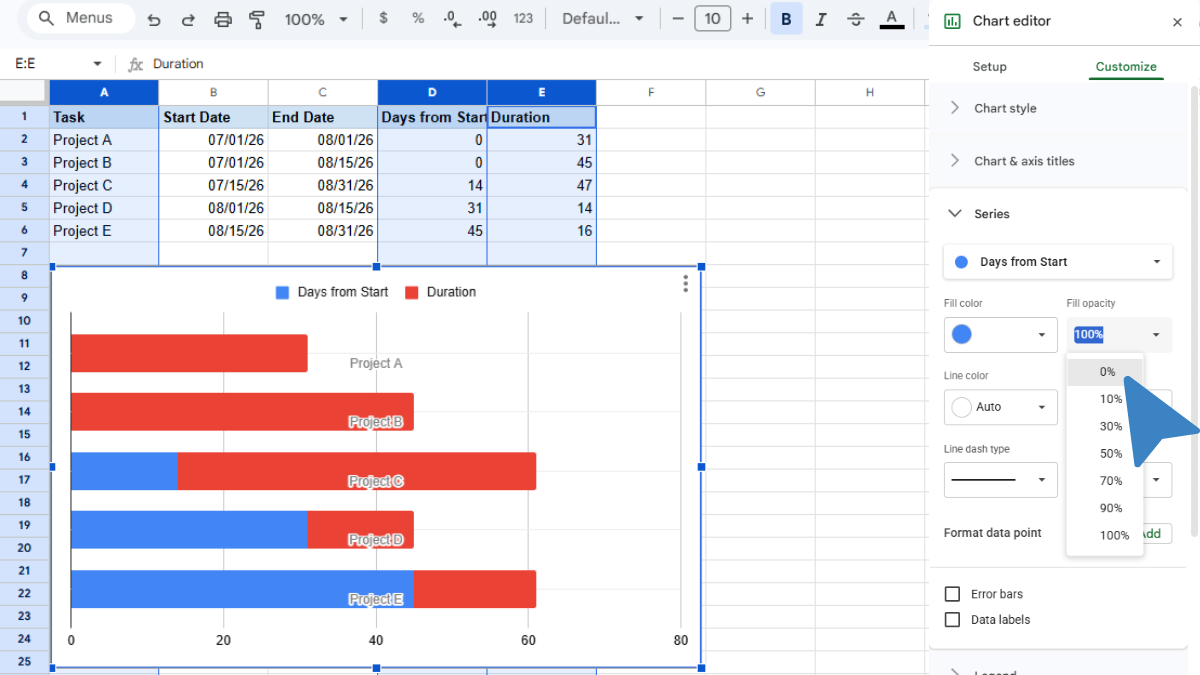
- Click the Customize tab in the Chart editor.
- Open the Series section, and from the dropdown, select the Days from Start series.
- Set its Fill opacity to 0% (or its Color to None).
The “Days from Start” segments vanish, leaving each duration bar floating at the right spot on the timeline. That’s the classic Gantt look.
One last fix: your tasks are probably listed bottom to top. To flip them:
- Still in the Customize tab, open Vertical axis and check Reverse axis order.
Your chart now reads top to bottom, matching your task list. That’s a working Gantt chart.
How do you make the Gantt chart easier to read?
A few optional touches turn a basic chart into something you’d actually present:
- Color the bars. In Customize → Series, select the Duration series and pick a solid, on-brand color.
- Show real dates on the timeline. By default the axis shows “days from start.” To display calendar dates instead, open Customize → Horizontal axis, set the Min to your project’s start date, and apply a date number format.
- Add a title and drop the legend. Rename the chart in Customize → Chart & axis titles, and set the Legend to None to keep it clean.
Prefer something lighter? If you only need a quick view of start and end dates, Google Sheets also has a built-in Timeline view (Insert → Timeline) that turns your table into an interactive timeline with no chart-building at all. It’s less customizable than the stacked-bar method, but it’s fast.
Where do the files for each task actually live?
Here’s the gap every Google Sheets Gantt chart eventually hits.
Your chart shows when each task happens. But each task also has files: the creative brief, the design mockup, the signed contract, the final deliverable. And none of those live in your spreadsheet.
So the schedule ends up in Sheets, while the actual work scatters across Drive, email, and Slack. When a teammate clicks “Design mockups,” there’s nothing to open. Someone pastes a Drive link that’s locked to their personal account, and the Request Access email loop begins. A week later, no one can find Final_Final_v3.
Your plan is centralized. Your files aren’t.
This is where UpSheet fits in. UpSheet is a Google Sheets extension, built by The Conductor, that lets you drag and drop files straight onto a cell. You can attach the brief, mockup, or deliverable directly to each task’s row in the same table your Gantt chart is built on.
Drop a file on a task cell, and UpSheet uploads it to a dedicated Google Drive folder it creates for that sheet, then marks the cell with a 📎 paperclip and a soft yellow highlight. Anyone with access clicks the cell to open the file. No tab-switching, no manual Drive uploads, no broken links.
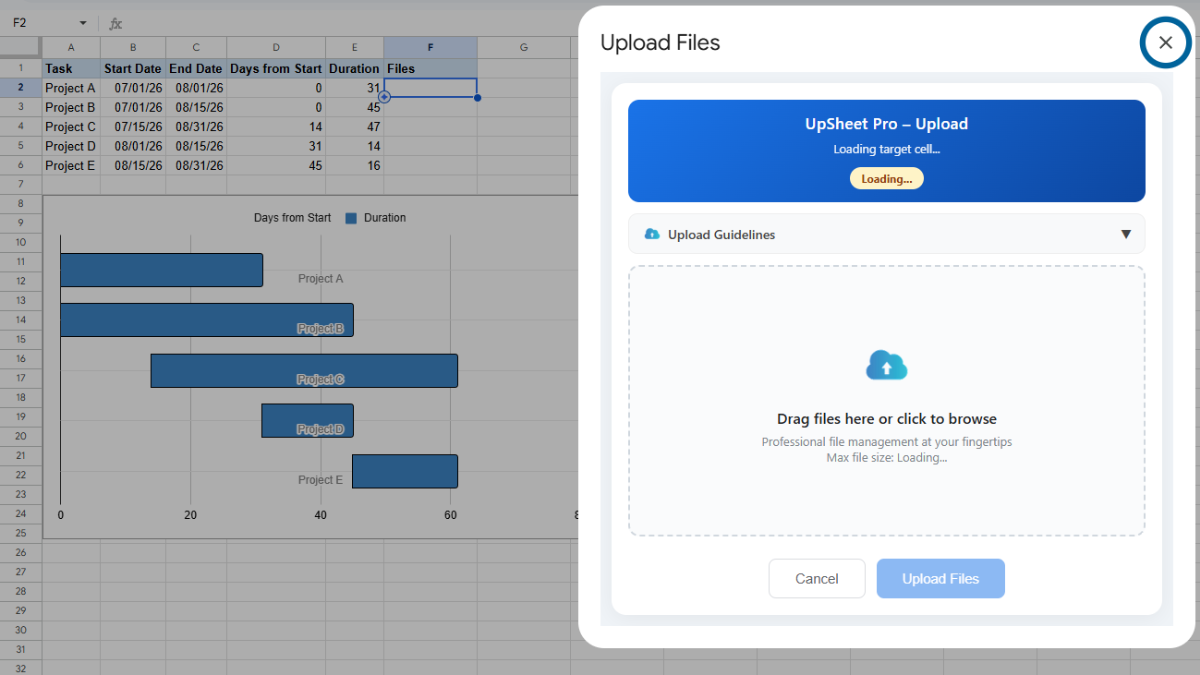
And because a project plan is never static, this detail matters. In TABLE mode, UpSheet ties each file to its task with a hidden row ID. So when you sort tasks, insert a new one, or reorder the list (exactly what you do to a Gantt chart every week), the attachments stay locked to the right task instead of drifting to the wrong row.
That turns your timeline into a single source of truth: the when and the what, side by side.
Drag, Drop, Done.
Frequently asked questions
Does Google Sheets have a built-in Gantt chart?
No. Google Sheets has no dedicated Gantt chart type. You create one using a stacked bar chart with two helper columns (days from start and duration), then hide the “days from start” series so only the task-duration bars show.
What’s the formula for a Gantt chart in Google Sheets?
Two formulas do the work. For “days from start,” use =B2-MIN($B$2:$B$9) to offset each task from the project’s earliest date. For “duration,” use =C2-B2 (end date minus start date). Format both result columns as plain numbers.
Can I make a Gantt chart in Google Sheets without an add-on?
Yes. The stacked bar chart method uses only built-in Google Sheets features and needs no add-on. Add-ons and extensions are optional. For example, UpSheet lets you attach each task’s files to its row, but the chart itself works on its own.
How do I fix tasks showing in the wrong order on my Gantt chart?
Open the Chart editor, go to the Customize tab, expand Vertical axis, and check Reverse axis order. Your tasks will then read top to bottom in the same order as your table.
Can my team attach files to tasks in a shared Google Sheets Gantt chart?
Yes, with UpSheet. Teammates with access to the sheet can drag files onto task cells, and everything collects in the one Drive folder UpSheet created for that spreadsheet, so the plan and its files stay together in a shared view.
Organize Your Work, Simplify Your Life
A Gantt chart tells your team when. UpSheet keeps the what, meaning every brief, asset, and deliverable, attached right where the work lives.
Attach files to any task cell without leaving your sheet, and let the timeline and the files finally live in one place. Drag, Drop, Done.
Start your 14-day free trial. It works inside the Google Sheet you already use, so there’s nothing new to learn. Pro is $9.99/month (or $79.99/year) when you’re ready.